Master Core Data Science Concepts, Techniques, and Tools

Introduction
Data science has emerged as one of the most transformative fields in the digital age, empowering organizations to make data-driven decisions that drive business success. From uncovering hidden patterns in vast datasets to creating predictive models that anticipate future trends, data science blends multiple disciplines, including statistics, computer science, and domain expertise.
In this article, we’ll explore the fundamentals of data science, focusing on essential techniques and tools. Whether you’re a beginner looking to enter the field or a professional seeking to deepen your understanding, this guide will provide you with a solid foundation in data science concepts, statistical analysis, and data visualization.
Interested in learning more about data science and machine learning? Don’t worry, I’ve got you covered! Feel free to explore some of my articles and lists on medium!
What is Data Science?
Data science is an interdisciplinary field that combines statistical analysis, computational techniques, and domain-specific knowledge to extract insights and knowledge from structured and unstructured data. It involves a range of processes, from data collection and cleaning to analysis and visualization, ultimately leading to actionable insights.
At its core, data science is about transforming raw data into meaningful information that can inform decisions. This involves not only understanding the data but also applying the right techniques and tools to analyze it effectively. Data scientists play a crucial role in this process, leveraging their expertise in mathematics, programming, and domain knowledge to solve complex problems and generate valuable insights.
Core Concepts in Data Science
Understanding the core concepts of data science is essential for anyone looking to explore or deepen their knowledge in this field. These concepts provide the foundation for various data science tasks, from statistical analysis to creating visualizations.
Statistical Analysis
Statistical analysis is at the heart of data science, allowing data scientists to understand, interpret, and draw conclusions from data. It involves collecting, analyzing, and interpreting data to identify trends, relationships, and patterns. Statistics is divided into two main areas:
- Descriptive Statistics: Summarizes and describes the features of a dataset, such as mean, median, mode, standard deviation, and variance.
- Inferential Statistics: Makes predictions or inferences about a population based on a sample of data, using techniques like hypothesis testing, confidence intervals, and regression analysis.
Data Wrangling
Data wrangling, also known as data munging, refers to the process of cleaning, transforming, and preparing raw data for analysis. This step is crucial because real-world data is often messy, incomplete, and unstructured. Effective data wrangling ensures that the data is accurate, consistent, and ready for analysis. Common tasks include handling missing values, correcting errors, and converting data types.
Data Visualization
Data visualization involves the graphical representation of data to help communicate insights effectively. By transforming complex data into visual formats like charts, graphs, and maps, data scientists can highlight patterns, trends, and outliers. Visualization makes it easier to understand and interpret data, facilitating better decision-making.
Machine Learning
While data science is a broad field, machine learning is a specialized area within it that focuses on building algorithms capable of learning from and making predictions on data. Machine learning models are trained on historical data to identify patterns and make decisions with minimal human intervention. It plays a critical role in predictive analytics, natural language processing, and many other data-driven applications.
Did you know that you can clap up to 50 times? Please consider helping me out by clapping and following me! 😊
Essential Data Science Techniques
To effectively analyze data and generate insights, data scientists employ a variety of techniques. These techniques are fundamental to the data science process and are applicable across different types of data and analysis tasks.
Descriptive Statistics
Descriptive statistics involves summarizing the basic features of a dataset. Techniques include:
- Measures of Central Tendency: Mean, median, and mode, which indicate the center of the data.
- Measures of Dispersion: Range, variance, and standard deviation, which describe the spread of the data.
- Frequency Distribution: Shows how often each value occurs in a dataset, often visualized as histograms or bar charts.
Inferential Statistics
Inferential statistics allows data scientists to make generalizations about a population based on a sample. Techniques include:
- Hypothesis Testing: Evaluating whether a certain hypothesis about a dataset is true.
- Confidence Intervals: Estimating the range within which a population parameter lies, with a certain level of confidence.
- Regression Analysis: Examining the relationship between variables, often used to predict outcomes.
Data Cleaning and Transformation
Data cleaning and transformation are critical steps in the data science workflow. Techniques include:
- Handling Missing Data: Filling in missing values using methods like mean substitution, or removing incomplete rows or columns.
- Data Normalization: Scaling data to a standard range, such as 0 to 1, to ensure consistent analysis.
- Data Encoding: Converting categorical data into numerical format, often necessary for machine learning models.
Data Visualization Techniques
Data visualization techniques help communicate the results of analysis. Techniques include:
- Line Charts: Useful for showing trends over time.
- Scatter Plots: Great for displaying the relationship between two variables.
- Heatmaps: Show the magnitude of a phenomenon as color in two dimensions, often used to visualize correlation matrices.
Automate Email Response Generation Using the ChatGPT API with Python

Automate Meeting Summaries Using the ChatGPT API with Python
Key Tools for Data Science
To effectively carry out data science tasks, professionals rely on a variety of tools that streamline the processes of data collection, analysis, visualization, and modeling. Here are some of the essential tools and technologies used in data science:
Programming Languages
- Python: Python is the most popular programming language for data science due to its simplicity, readability, and a vast ecosystem of libraries specifically designed for data analysis, machine learning, and visualization. Libraries like Pandas, NumPy, and Scikit-learn are widely used.
- R: R is another powerful programming language favored by statisticians and data scientists for statistical analysis and data visualization. It has a rich set of packages, such as ggplot2 for visualization and dplyr for data manipulation.
Libraries and Frameworks
- Pandas: Pandas is a Python library that provides high-level data structures and functions designed to make data manipulation and analysis easy and fast. It is particularly useful for handling structured data like CSV files or SQL databases.
- NumPy: NumPy is a fundamental library for numerical computing in Python. It provides support for arrays, matrices, and many mathematical functions to operate on these data structures.
- Matplotlib: Matplotlib is a plotting library in Python that allows data scientists to create static, interactive, and animated visualizations in a variety of formats.
- SciPy: SciPy builds on NumPy and provides additional functionality for scientific and technical computing, including modules for optimization, integration, interpolation, and statistical functions.
- Scikit-learn: Scikit-learn is a powerful library for machine learning in Python. It provides simple and efficient tools for data mining and data analysis, supporting both supervised and unsupervised learning algorithms.
Tools for Statistical Analysis
- StatsModels: StatsModels is a Python module that allows users to explore data, estimate statistical models, and perform statistical tests. It complements Pandas and is particularly useful for more complex statistical analysis.
- SPSS: SPSS (Statistical Package for the Social Sciences) is a software package used for statistical analysis in social science. It’s widely used for data management, statistical analysis, and data documentation.
Data Visualization Tools
- Seaborn: Seaborn is a Python data visualization library based on Matplotlib that provides a high-level interface for drawing attractive and informative statistical graphics.
- Tableau: Tableau is a powerful data visualization tool that allows users to create a wide range of interactive and shareable dashboards. It is highly regarded for its ability to connect to multiple data sources and simplify complex data into understandable visuals.
- Power BI: Power BI is a business analytics service by Microsoft that provides interactive visualizations and business intelligence capabilities with a simple interface for end users to create their reports and dashboards.
range (Python) vs. arange (NumPy)
Looking to boost your Python coding expertise? Explore my articles on essential Python exercises and mastering the sys module!
Practical Example: Data Analysis with Python
To put the concepts and tools we’ve discussed into practice, let’s walk through a basic data analysis example using Python. We’ll cover the steps of data collection, cleaning, exploratory data analysis (EDA), and visualization.
Data Collection
For this example, let’s assume we have a dataset containing information about various products, including their prices, categories, and sales.
import pandas as pd

# Sample dataset
data = {
    'Product': ['A', 'B', 'C', 'D', 'E'],
    'Category': ['Electronics', 'Electronics', 'Clothing', 'Clothing', 'Furniture'],
    'Price': [120, 150, 50, 60, 300],
    'Sales': [100, 80, 200, 150, 40]
}

df = pd.DataFrame(data)
print(df)
Data Cleaning
Before analyzing the data, it’s crucial to clean it. This might involve handling missing values, correcting data types, or normalizing the data.
# Checking for missing values
print(df.isnull().sum())

# Normalizing the price column
df['Price'] = df['Price'] / df['Price'].max()
print(df)
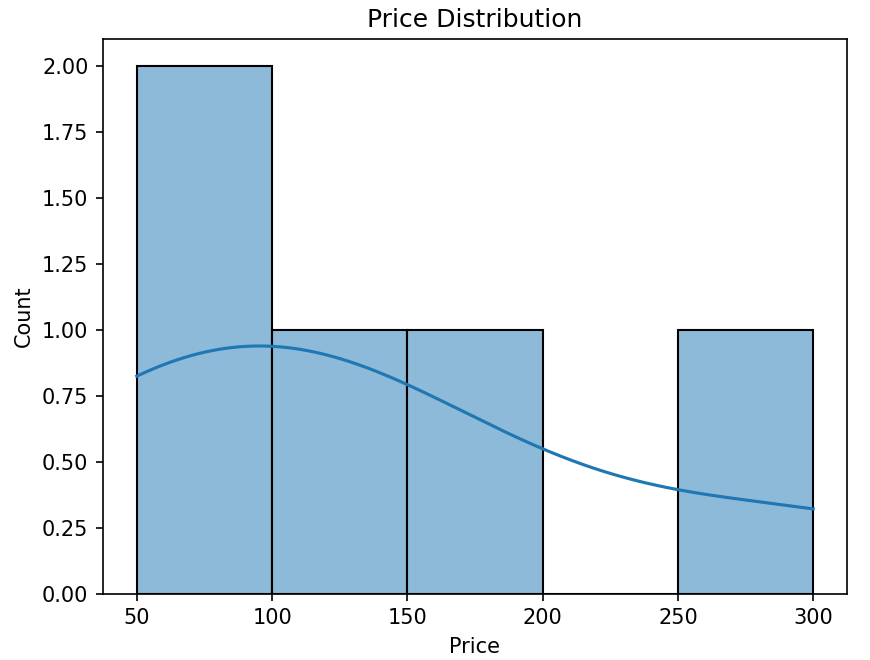
Exploratory Data Analysis (EDA)
Exploratory Data Analysis involves summarizing the main characteristics of the data, often using visual methods.
import seaborn as sns
import matplotlib.pyplot as plt

# Visualizing the distribution of prices
sns.histplot(df['Price'], bins=5, kde=True)
plt.title('Price Distribution')
plt.show()

# Visualizing sales by category
sns.barplot(x='Category', y='Sales', data=df)
plt.title('Sales by Category')
plt.show()

import seaborn as sns
import matplotlib.pyplot as plt


# Visualizing sales by category
sns.barplot(x='Category', y='Sales', data=df)
plt.title('Sales by Category')
plt.show()

Visualization
Finally, we can create more complex visualizations to further explore the data.
# Scatter plot of Price vs. Sales
sns.scatterplot(x='Price', y='Sales', hue='Category', data=df)
plt.title('Price vs. Sales by Category')
plt.show()

This example demonstrates a basic workflow for data analysis using Python, including data collection, cleaning, exploratory analysis, and visualization.
- Elevating Python Code with f-strings: The Definitive Guide
- Automating Boring Routine Tasks with Python!
Conclusion
Data science is a multidisciplinary field that plays a crucial role in today’s data-driven world. By leveraging techniques like statistical analysis, data wrangling, and visualization, data scientists can uncover insights that drive strategic decisions and innovations. Understanding the core concepts, such as descriptive and inferential statistics, data cleaning, and exploratory data analysis, is fundamental to mastering data science.
In this article, we explored the essential techniques and tools that form the foundation of data science. We discussed the importance of programming languages like Python and R, along with powerful libraries such as Pandas, NumPy, and Matplotlib, which are indispensable for data manipulation, analysis, and visualization. Additionally, we walked through a practical example of data analysis using Python, demonstrating how to apply these tools in a real-world scenario.
Whether you are just starting out or looking to deepen your understanding of data science, mastering these techniques and tools will equip you with the skills necessary to tackle complex data challenges and derive meaningful insights. The key to success in data science lies in continuous learning and hands-on practice with diverse datasets and tools.
Thank you for reading, and happy data exploring!

Final Words:
Thank you for taking the time to read my article.
This article was first published on medium by CyCoderX.
Hey There! I’m CyCoderX, a data engineer who loves crafting end-to-end solutions. I write articles about Python, SQL, AI, Data Engineering, lifestyle and more!
If you want to explore similar articles and updates, feel free to explore my Medium profile:
Join me as we explore the exciting world of tech, data and beyond!
What did you think about this article? Let me know in the comments below … or above, depending on your device! 🙃
In Plain English 🚀
Thank you for being a part of the In Plain English community! Before you go:
- Be sure to clap and follow the writer ️👏️️
- Follow us: X | LinkedIn | YouTube | Discord | Newsletter
- Visit our other platforms: CoFeed | Differ
- More content at PlainEnglish.io
Data Science Fundamentals: Techniques and Tools was originally published in Artificial Intelligence in Plain English on Medium, where people are continuing the conversation by highlighting and responding to this story.
* This article was originally published here